
People like to compare price run-ups of tech stocks to what happened to Enron. The implication is that, since Enron failed, these companies will as well. But this argument does not work.
An occasional mode of security analysis (mostly on social media) is to identify a formerly high-flying stock, then line up a currently high-flying stock alongside it, and demonstrate that, relative to some starting point, the two price paths look similar. The implication (or outright claim) is that the currently high-flying stock is sure to meet the same inglorious fate suffered by the former high-flyer.
Among that latter category, Enron is a particularly popular parable. (I recall seeing Tesla and Nvidia compared to the Enron stock price run-up.) The next chart shows the stock price run-up of Enron in the years leading up to its demise in December of 2001. I then find a start date (there are many to choose from) for other big tech stocks so that their price behavior one year forward from that date closely matches the behavior of Enron’s stock price from March of 1999 to March of 2000.
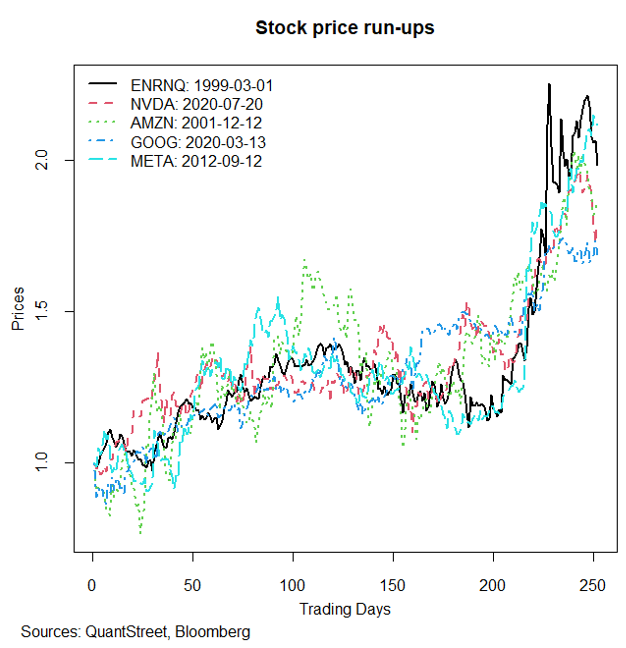
Indeed, through the magic of data mining, for Nvidia, Amazon, Google, and Meta, there exists a start date (shown in the legend of the above chart), so that their next-one-year price behavior looks a lot like Enron’s. To make the series comparable, all stock prices are normalized to $1 at the beginning of their respective time periods. For Amazon and Meta, the start dates of their best-match-to-Enron time periods are in 2001 and 2012 respectively. For Nvidia and Google, the start dates are in 2020.
Surely this must mean that all five companies will go bankrupt in the subsequent year or two following the end of this analysis.
Well, not quite…
The next chart extends the time frame of the prior figure by an additional two years: The prices run from the start of their best-match-to-Enron dates to three years forward.
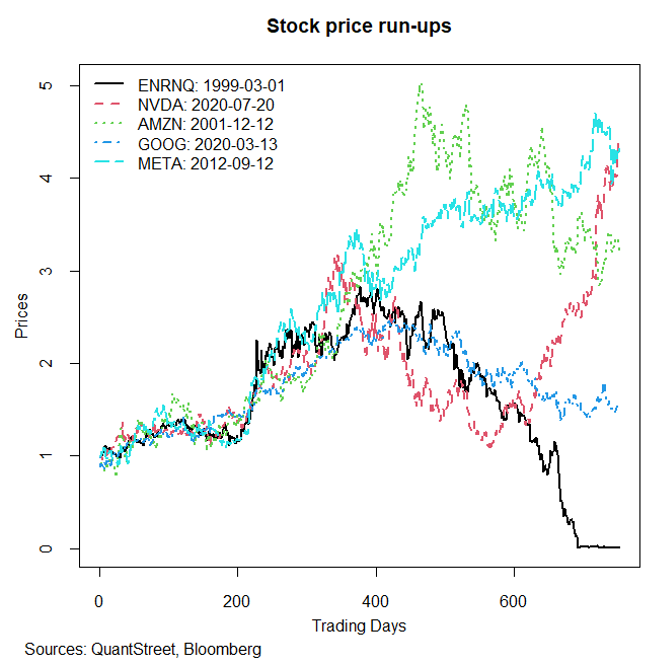
It should not be surprising that Enron does, indeed, go bankrupt in the new expanded time window (that’s true by construction). What about the other companies? All but Google did quite well in this expanded three-year window. And we all know the performance of these tech stocks over the last few months.
Just because there exists a starting point such that some stock’s price path looks a lot like Enron’s in the years before Enron’s collapse teaches us nothing about the stock’s prospects. Any stock that’s gone up a lot, at some point, probably looked a little bit like Enron during its bubble phase.
There is no useful takeaway from this, other than it’s easy to write code to identify such magic.
This article was originally published on Advisor Perspectives.